Power Generation by Fuel Source, 1990-2020
URL: https://data.gov.ph/index/public/dataset/power-generation-by-fuel-source,-1990-2020/mhb14dc0-8tio-af0u-6nac-euxrn6bz48rm
Data Source: Department of Energy (DOE) - Philippines
For this dataset, I first sought to check and clean the data at hand. I then proceeded to create an Excel Chart to visualize the trends of power generation by different fuel sources in the Philippines from 1990 to 2020. The analysis provided insights into how the energy mix has evolved over the years, highlighting shifts towards renewable energy sources and changes in reliance on traditional fuels. Included in the dataset is the grand total, but it felt out of place to include it in the visualization as it would clutter the chart and detract from the individual fuel source trends. Thus, I opted to exclude it from the chart for clarity.
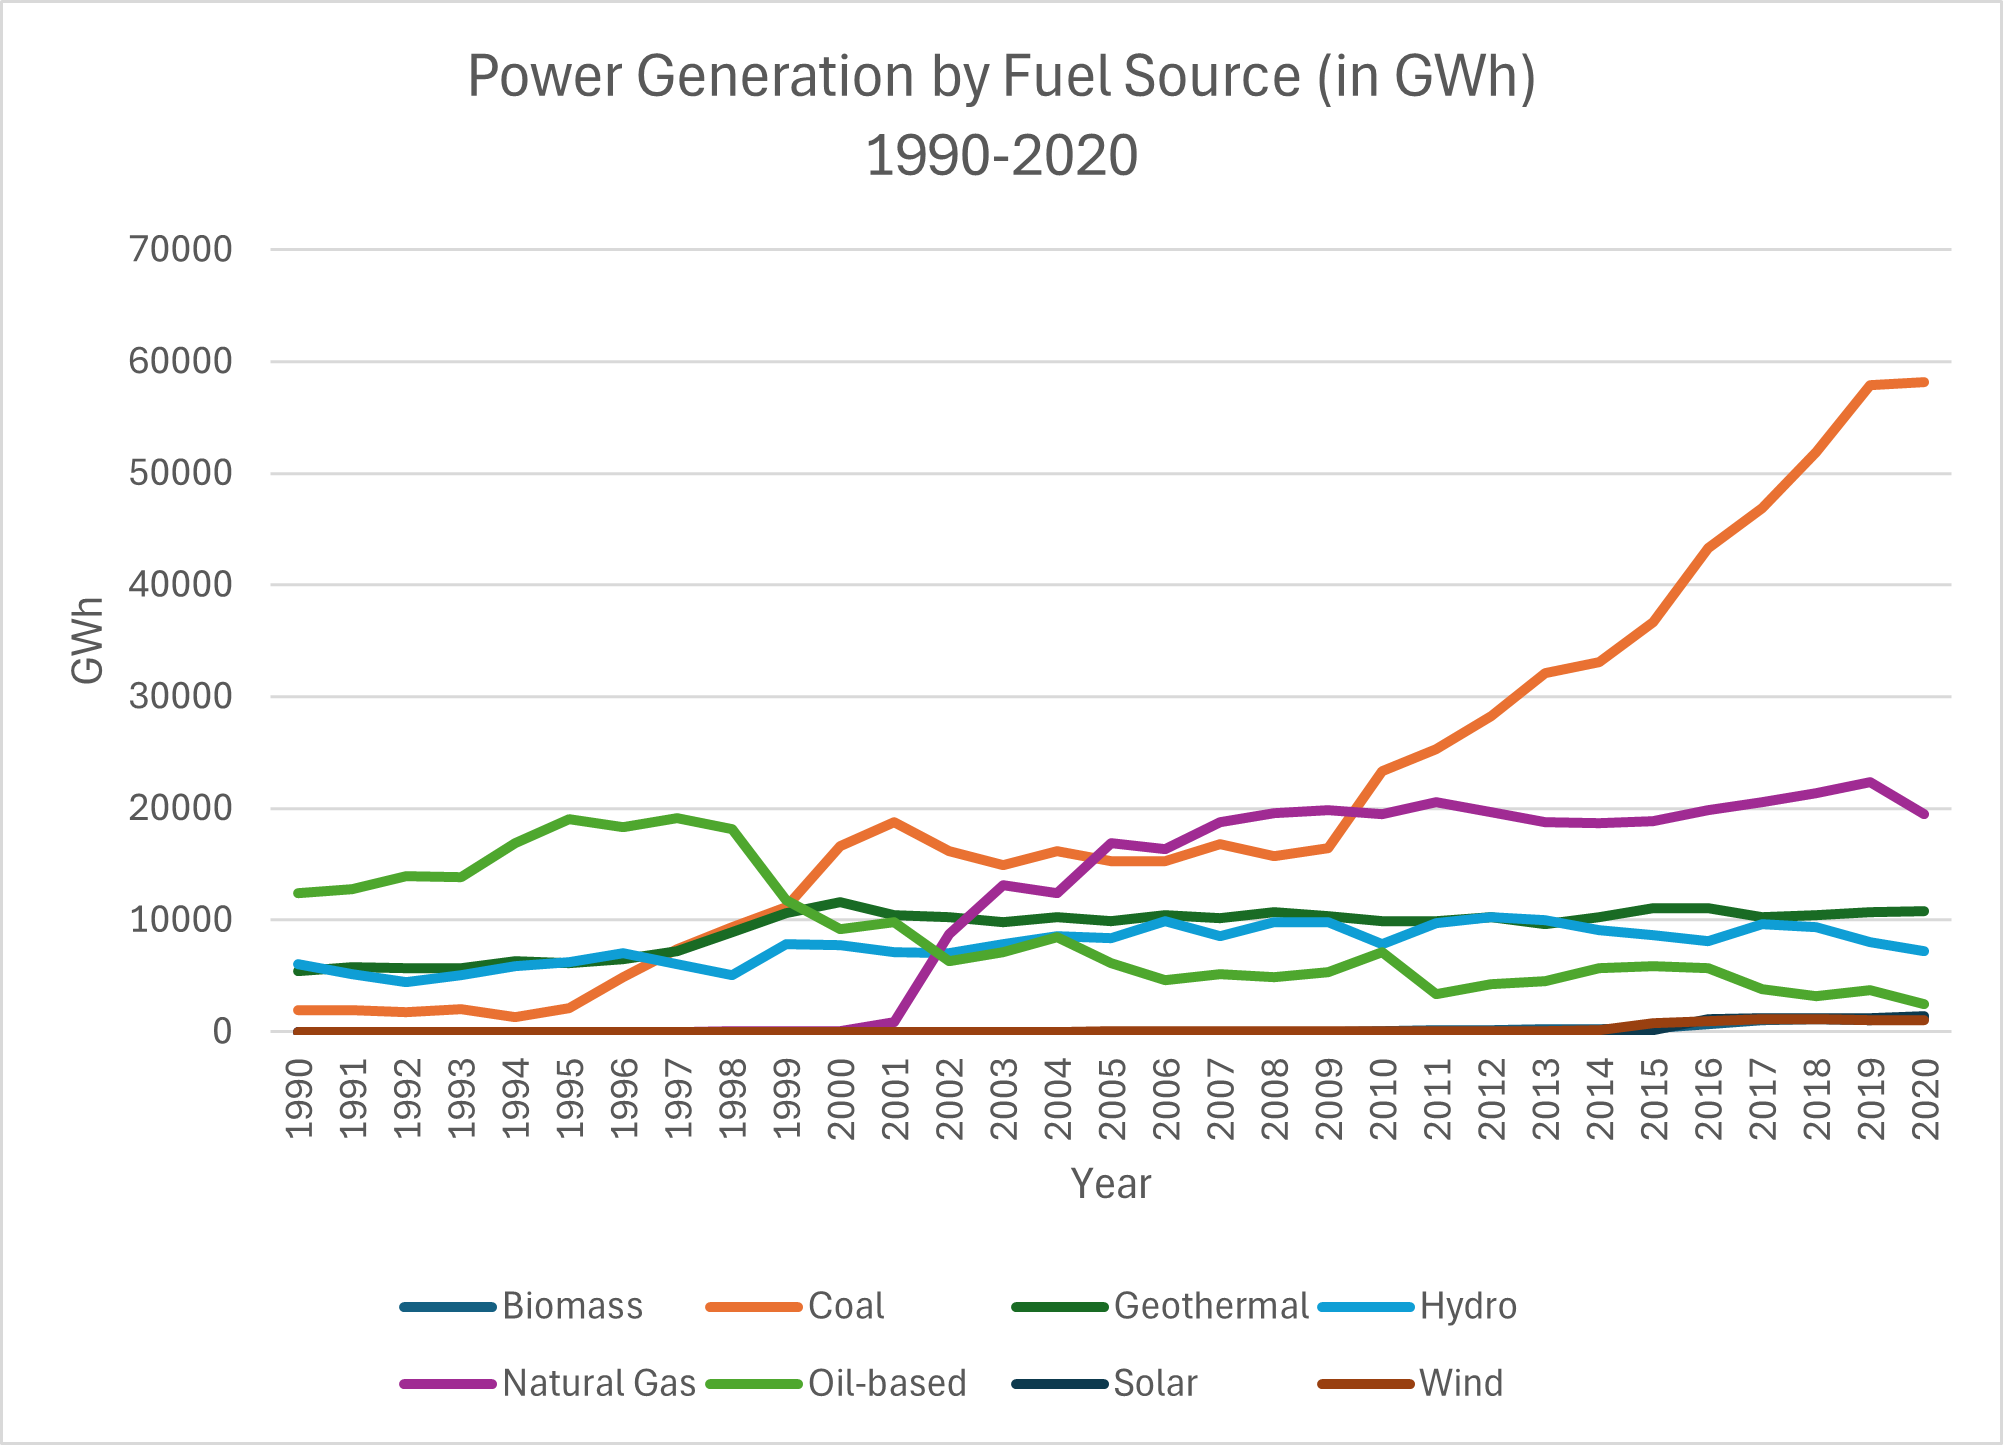
Excel Chart
After preparation, I proceeded to create an Excel Chart to visualize the trends of power generation by different fuel sources in the Philippines from 1990 to 2020. The analysis provided insights into how the energy mix has evolved over the years, highlighting shifts towards renewable energy sources and changes in reliance on traditional fuels. Included in the dataset is the grand total, but it felt out of place to include it in the visualization as it would clutter the chart and detract from the individual fuel source trends. Thus, I opted to exclude it from the chart for clarity.
Tableau Line Chart
I also created a Tableau version of the same chart to further enhance the visualization and interactivity of the data. I further improved upon the charts design by making it more visually appealing and easier to interpret.
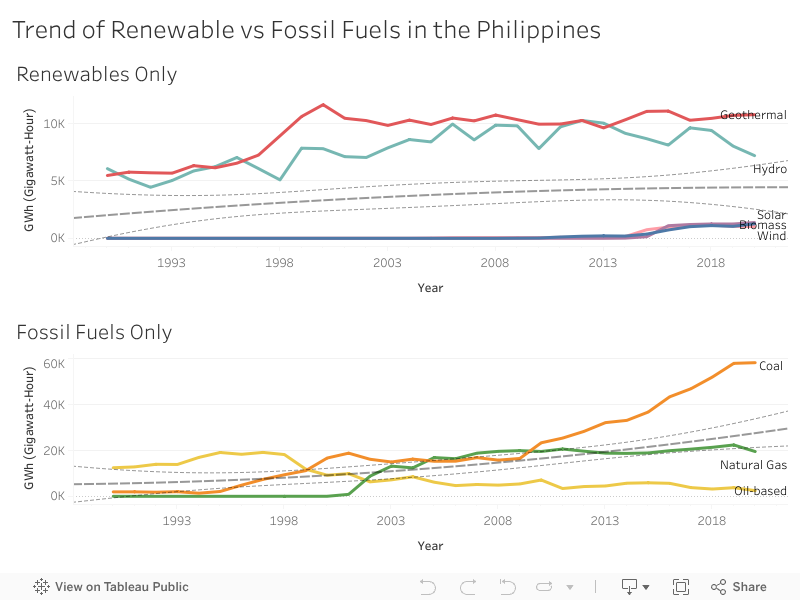
Renewable vs Fossil Fuels: A Dashboard Trend Comparison
In order to narrow down on the key insights from the data, I created a Tableau dashboard that specifically compares the trends of renewable energy sources against fossil fuels over the years.
We can directly see in the trendline how the development renewable energy sources has stagnated in the span of 2 decades (1990-2020) while fossil fuels have continued to rise. This insight can be crucial for policymakers and stakeholders in the energy sector to understand the pace of renewable energy adoption and to strategize for a more sustainable energy future.
The primary offender for the rise in fossil fuels is single-handedly dominated by coal, which has seen a rapid increase in usage for power generation in the Philippines during this period. Oil-based and natural gas-based power generation have remained relatively stable with a trend that signifies a slight decline.
For the renewable side, geothermal power has seen a rise in fall, generally only increasing every so slightly, with a more recent downtrend. The same story can be said for hydroelectric power, ever so slightly increasing over the years, but trending downwards in recent times. Solar and wind power, while starting from a very low base, have shown more noticeable growth in recent years, indicating a potential shift towards these sources in the future. noticeable growth in recent years, indicating a potential shift towards these sources in the future.